Magna raises 2019 forecasts

Magna raised its 2019 forecast for global advertising growth to 4.7 percent from 4 percent, as the macro-economic environment is expected to remain strong in most of the top advertising markets (United States, China, India), according to an announcement.

The company forecast U.S. advertising growth to slow to 2.4 percent, mostly due to the lack of cyclical events such as elections. Excluding the effect of cyclical events in 2018 and 2019, underlying ad spend will grow by 4.5 percent in 2019, compared with 5.3 percent in 2018.

Almost two-thirds of digital ad sales (62 percent) come from impressions and clicks on mobile devices (mostly smartphones). Mobile ad sales grew by 32 percent in 2018 while desktop-based ad revenue shrank 2 percent because of ad blocking and lower inventory.

Magna bases its forecast on net revenues of media companies instead of media spending by advertisers, the metric that Zenith and GroupM use.

Magna’s U.S. Market Forecasts

Net Advertising Revenues 2018
Size ($ m)
2018 Growth 2019 Growth
TOTAL OFFLINE 96,433 -4.8% -4.1%
National TV (incl. CE) 42,852 1.2% -3.1%
National TV (excl. CE) 42,105 -0.5% -1.5%
Local TV (incl. CE) 21,810 10.5% -16.3%
Local TV (excl. CE) 18,607 -4.1% -4.4%
Print 14,973 -16.7% -17.6%
Radio 13,232 -4.2% -4.5%
OOH 8,091 3.4% 2.4%
TOTAL DIGITAL 107,027 16.5% 12.2%
Mobile 70,662 30.5% 21.2%
Desktop 36,365 -3.6% -5.2%
Search 47,800 16.1% 12.5%
Video 13,147 25.8% 19.5%
Social 30,103 32.9% 21.9%
GRAND TOTAL (incl. CE) 208,149 7.5% 2.4%
GRAND TOTAL (excl. CE) 203,460 5.3% 4.5%

Zenith forecasts slower growth in 2019

Publicis Groupe’s Zenith forecast global advertising expenditure will grow 4.5% by the end of this year, boosted by the Winter Olympics, FIFA World Cup and US mid-term elections. Growth will then remain steady and positive for the rest of our forecast period to 2021, at 4.0% in 2019, 4.2% in 2020 and 4.1% in 2021, according to an announcement.

Amazon will benefit from the growing market for e-commerce ad spending in the United States. E-commerce advertising is more established in China, driven by investments by e-commerce platforms like Alibaba. E-commerce advertising has risen from 0.8 percent of all adspend in China in 2009 to an estimated 18.2 percent this year.

GroupM cuts 2019 forecast

GroupM, WPP’s media buying group, slightly cut 2018 growth estimates from 4.5 percent to 4.3 percent. 2019 growth projections were also lowered from 3.9 percent to 3.6 percent, with total new investment anticipated to reach $19 billion instead of $23 billion predicted earlier, according to an announcement.

Rising interest rates, China’s slowing economic growth and possible trade wars were cited as reason for the lower estimate.

Adobe Analytics published data about online sales during the Black Friday weekend.

Day Sales Yearly Gain
Cyber Monday $7.9 billion (biggest online shopping day of all time) 19.7 percent
Thanksgiving Day $3.7 billion 28 percent
Black Friday $6.2 billion 23.6 percent
Saturday and Sunday $6.4 billion 25 percent

Revenue from smartphone users rose 48.1 percent to $2.1 billion on Cyber Monday.

Mobile devices represented 51.4 percent of site traffic, including 43.6 percent from smartphones and 7.8 percent from tablets.

Mobile devices made up 34 percent of online sales, including 26.3 percent from smartphones and 7.7 percent from tablets.

Top sellers on Cyber Monday included the Nintendo Switch, Little Live Pets, Red Dead Redemption 2, LG TVs, drones (DJI, Air Hogs, Sky Viper), Dell laptops, FurReal Pets and Amazon Echo devices.

Black Friday had the best deals for TVs (prices down 18 percent) and computers (17.8 percent). On the Sunday before Cyber Monday, the best deals were for toys (prices cut 31.6 percent). Adobe forecast the biggest discounts for furniture and bedding (14 percent) to happen on Giving Tuesday.

Denver had the biggest shopping baskets since Thanksgiving with orders averaging $163, followed by $157 in San Francisco, $156 in New York, $156 in Portland and $154 in the Seattle/Tacoma area. The nationwide average rose 6.1 percent from a year earlier to $138, indicating shoppers are more comfortable buying more and bigger ticket items online, Adobe said in a statement.

Large retailers ($1 billion or more in annual e-commerce revenue) saw 6 percent higher conversion rates on smartphones, indicating their investments in improving the mobile shopping experience are paying off.

Social media didn’t help to drive revenue, with a 1.1 percent share of total sales on Cyber Monday, similar to past years. Direct website traffic drove the most revenue with a 25.3 percent share of sales (down 1.2 percent from the prior year), followed by paid search at 25.1 percent (up 7.4 percent), natural search at 18.8 percent (down 2.8 percent) and email at 24.2 percent (up 0.5 percent).

Sales Drivers

Source Share Trend
Direct website traffic  25.3 percent Down 1.2 percentage points
Paid search 25.1 percent Up 7.4 percentage points
Natural search 18.8 percent Down 2.8 percentage points
Email 24.2 percent Up 0.5 percentage points
Social media 1.1 percent Little changed

Source: Adobe Analytics

Photo: Fabian Hurnaus/Pexels

Amazon regained the lead in smart-speaker market share during the third quarter after lagging behind Google during the prior six months, according to a report from researcher Canalys.

Amazon promoted its Echo smart speakers going into its annual Prime Day shopping event, while Google cut prices of its Google Home smart devices to remain competitive with Amazon, Canalys said. Google was the top seller of smart speakers during the second and third quarters, the researcher said.

Smart-speaker shipments more than doubled (up 137 percent) to 19.7 million in Q3 2018 from a year earlier.

Amazon shipped 6.3 million Echo smart speakers that have its Alexa voice assistant, while Google sold 5.9 million of its Google Home devices that have Google Assistant.

While Amazon, Google and Amazon are the top sellers of smart speakers in the United States, Alibaba, Xiaomi and Baidu are the leaders in mainland China.

Millennials are having children and buying homes later in life than past generations, according to a study commissioned by accounting firm EY.

The generation born after 1995 feels more secure economically than they did two years ago, but they aren’t convinced the stability will last. Millennials also face record levels of student debt.

Family

  • 40 percent of millennial women are mothers. When Generation X women were the same age, 57 percent already had children.
  • 40 percent of millennials own their own homes, compared with 26 percent in 2016. However, 45 percent of Gen Xers and Baby Boomers were homeowners when they were the same age.

Finances

  • 80 percent of millennials say that student debt has forced them to delay home ownership.
  • 59 percent worry about paying back their student loans.
  • 35 percent claim to be making just enough money to cover their expenses
  • 30 percent are not making enough to even keep up with expenses.
  • 75 percent worry that Social Security will be unavailable when they are ready to retire, and 70 percent worry about not having enough money to live off of when they eventually retire.
  • Only 6 percent feel they are making a lot more than required to cover basic needs. For millennial women, the figure is only 3 percent.
  • 63 percent would have difficulty covering an unexpected $500 expense.
  • 44 percent would dedicate $5,000 in lottery winnings to paying off bills and loans, signaling a struggle to launch, save and invest.
  • 25 percent of 18-21 year olds feel they pay too much in taxes, rising to 39 percent by ages 30-34.
  • 30 percent of those making less than $20,000 a year felt they paid too much in taxes, rising to 37 percent of those who made more than $100,000 a year.
  • 71 percent of millennials worry about America’s debt and deficit levels.
  • Only 36 percent of white men and 27 percent of white women believe they’ll be better off than their parents.
  • A majority of hispanic men (52 percent) and black women (54 percent) believe their standard of living will surpass that of their parents.

Career

  • 86 percent of millennials believe working hard is extremely or very important to getting ahead in life.
  • Nearly 40 percent believe that staying with one company is the best way to advance their career.
  • 72 percent believe that startups and entrepreneurship are essential for new innovation and jobs in our economy.
  • 59 percent believe that the government makes it difficult for people to succeed in starting their own businesses.
  • 38 percent say they do not have the financial means to start their own business — though they would like to — and 16 percent are afraid that their business would not succeed.
  • 58 percent have considered starting their own business.
  • 58 percent believe their generation is more entrepreneurial than other generations.
  • Black women are the only millennial demographic in which a plurality (39 percent) believe that starting their own business is best way to get ahead.
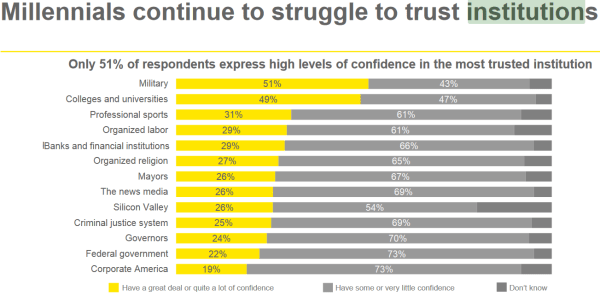
  • 71 percent of black women have considered starting their own business, making them the most entrepreneurially inclined of the millennial cohort. Their inclination to chart an independent path may stem from their lack of confidence in established institutions.

Social

  • 77 percent of millennials report that they are proud to be American.
  • But, only 30 percent report high levels of confidence in American institutions.
  • Since 2016, trust in higher education, corporate America, Silicon Valley, organized labor and the criminal justice system has decreased, while trust in media, organized religion and local government has increased.
  • 64 percent believe high-net-worth individuals and big corporations are not paying their fair share of taxes.
  • 50 percent feel they are paying the right amount of taxes.

Research Now conducted a survey on behalf EY of 1,202 U.S. residents ages 20 to 36 nationwide. The researcher contacted 842 respondents online and 360 by cellphone. Survey participants were contacted between June 27 through July 13.


Source: EY

Source: pixabay.com

Contrary viewpoints

No, Facebook didn’t affect U.S. election in 2016

Did Fake News On Facebook Help Elect Trump? Here’s What We Know

Study: Social Media and Fake News in the 2016 Election

Did fake news help elect Trump? Not likely, according to new research

Hard Questions: Russian Ads Delivered to Congress

Mark Zuckerberg denies that fake news on Facebook influenced the elections

Yes, Facebook affected U.S. election in 2016

Russia-orchestrated campaigns brought fringe ideas into the mainstream

Embattled and in over his head, Mark Zuckerberg should — at least — step down as Facebook chairman

Facebook’s role in Trump’s win is clear. No matter what Mark Zuckerberg says

Study: Partisanship, Propaganda, and Disinformation: Online Media and the 2016 U.S. Presidential Election

Study: Trump may owe his 2016 victory to ‘fake news,’ new study suggests

Oh, and Facebook also affected the 2012 election…

Facebook’s secret newsfeed experiments affected voter turnout in the 2012 election

Photo by Helena Lopes from Pexels

U.S. millennials spend an average of $2,164.99 month, or $25,979.88 a year, according to a survey by Ally Financial.

The Detroit-based bank asked 2,000 young adults about their incomes, expenses and attitudes toward financial planning.

The average millennial said an annual income of $53,000 is enough to live comfortably.

Seven in 10 millennials don’t believe Social Security will be around by the time they’re old enough to collect it.

Key Findings

Average Millennial Monthly Expenses

Food $325.44
Housing/Utilities $426.73
Social/Entertainment $198.51
Clothes $208.14
Travel $222.99
Tech $222.23
Student Loans $191.43
Medical Costs $209.94
Subscriptions (Netflix, Hulu, etc.) $32.65
Memberships (Gym, etc.) $29.13
Transportation $61.89

Top 8 Things Millennials Are Currently Saving For

Emergencies (medical, car or home repair) 44%
Experiences like vacation/travel, wedding, etc. 41%
Retirement 41%
Deposit for new apartment/house 38%
Education (yours or your child’s) 35%
Home improvements 31%
New tech (iPhone, video game console, etc.) 25%

Source: Ally Bank

Reporter’s Notes:

Real mean personal income in the United States grew 3.3 percent to $46,550 in 2016, the most recent year of available data from the U.S. Census Bureau.

The median household income grew 1.8 percent to $61,372 in 2017, the most recent year of available data from the U.S. Census Bureau. A household refers to a single housing unit and all of the people that live in it.

Definitions of the millennial generation vary, but Pew Research Center said the group is made up of people born from 1981 to 1996. Pew forecast that millennials will become the largest U.S. demographic group in 2019 with 73 million people as baby boomers decline to 72 million. Generation X, born from 1965 to 1980, was never bigger than the baby boom generation, but will overtake the older group starting in 2028 when they both have 65 million people, according to Pew’s estimate.

Amazon.com’s aggressive strategy for getting tax breaks has helped the company to grow, according to Good Jobs First, which tracks government subsidies and economic development. The e-commerce giant has received about 20 economic development subsidy packages a year since 2012 for its warehouses and data centers—$1.6 billion and counting as of mid-2018.

Further reading:

Florida man seeks a quarter of a billion dollars that won’t help state 

The Pathology of Privilege


Source: Pixabay.com

Phone numbers are on the verge of extinction as almost half (46 percent) of Americans ages 18-22 ask for a social media handle instead of a phone number when meeting new people, according to a survey of mobile customers by Bank of America.

Other key findings:

Most Americans (58 percent) anticipate the country will become entirely cashless in their lifetime. About one quarter (23 percent) of Americans say they can avoid using cash for a month at a time, while 19 percent said they can forego using physical currency for a full year.

The most popular apps are navigation (used by 68 percent of consumers), entertainment (58 percent), retail (55 percent) and music (51 percent). Americans prefer an app that is easy to use (35 percent) and efficient (23 percent), compared with one that is entertaining (12 percent) or social (5 percent).

Person-to-person payments have become more popular, rising eight percentage points in the past year to 44 percent of consumers. PSP gift is considered appropriate for birthdays (58 percent of respondents), graduations (48 percent), holidays (48 percent), allowances (42 percent) and weddings (38 percent).

Mobile communications are the most common way to stay in touch with siblings (74 percent), friends (68 percent) and parents (53 percent), while in-person communication is more common with significant others (84 percent), children (67 percent) and colleagues (61 percent).

Mobile bank apps have grown their user base from 48 percent of people surveyed in 2015 to 70 percent this year. The biggest adopters of mobile banking are Generation Z (78 percent), millennials (77 percent), Generation X (67 percent) and baby boomers (59 percent).

Many Americans are comfortable using biometrics on their smartphones such as fingerprint/touch ID (69 percent), voice recognition (65 percent), facial recognition (50 percent) and retina scan (44 percent).

Researcher Convergys surveyed 1,001 adults 18 and older with a current bank account at Bank of America and who own a smartphone.

Traffic congestion is likely to get worse in the next few years for six main reasons, according to a report by the National Parking Association and PwC:

  1. Macroeconomic conditions. Vehicle miles traveled, which are directly correlated to economic growth, are forecast to grow by 14 percent from 2017 to 2030 as commercial activity expands.
  2. Urbanization. The U.S. population is growing and shifting from rural to urban areas. The portion of people living in urban areas will grow from 81 percent in 2010 to 85 percent in 2030.
  3. Transportation network company (TNC) growth. Ride-hailing is boosting demand for transportation while shifting travel from public transit. The shift puts more cars on the street and contributes to congestion at the curb.
  4. E-commerce growth. Deliveries are increasing, and they’re not reducing private-vehicle use for trips to shopping malls and brick-and-mortar stores as much as was once expected. E-commerce increased from 0.3 percent of retail spending in 1998 to 8.7 percent in 2014.
  5. Infrastructure underinvestment. U.S. public infrastructure was awarded a grade of D+ by the American Society of Civil Engineers and needs more investment to keep pace with that of other developed nations. The federal gasoline tax, which funds much of transportation infrastructure expenditure, hasn’t been raised since 1993.
  6. Policy and program development. Current policies and programs have had mixed success in reducing congestion, with many leading to unintended consequences that make congestion.